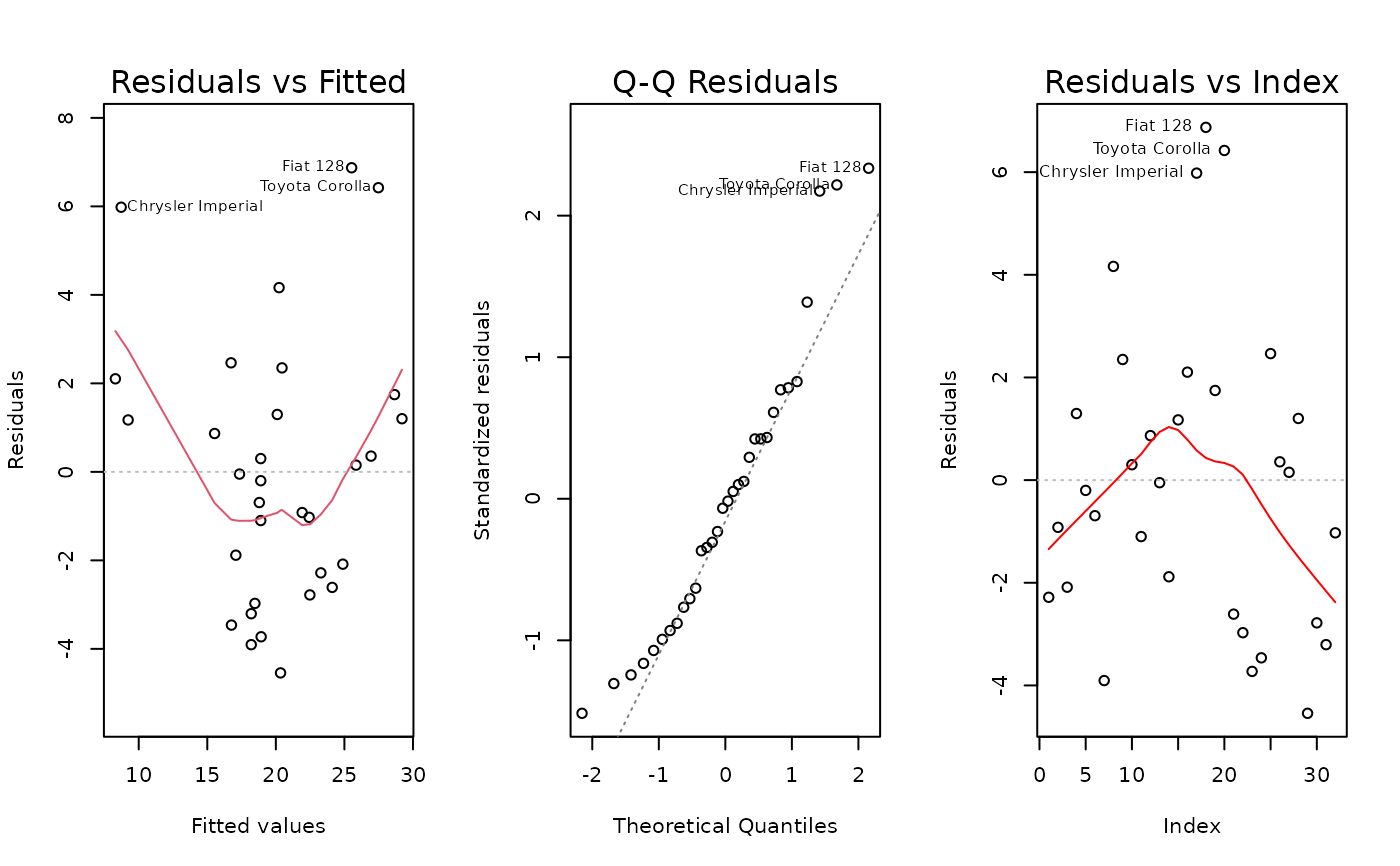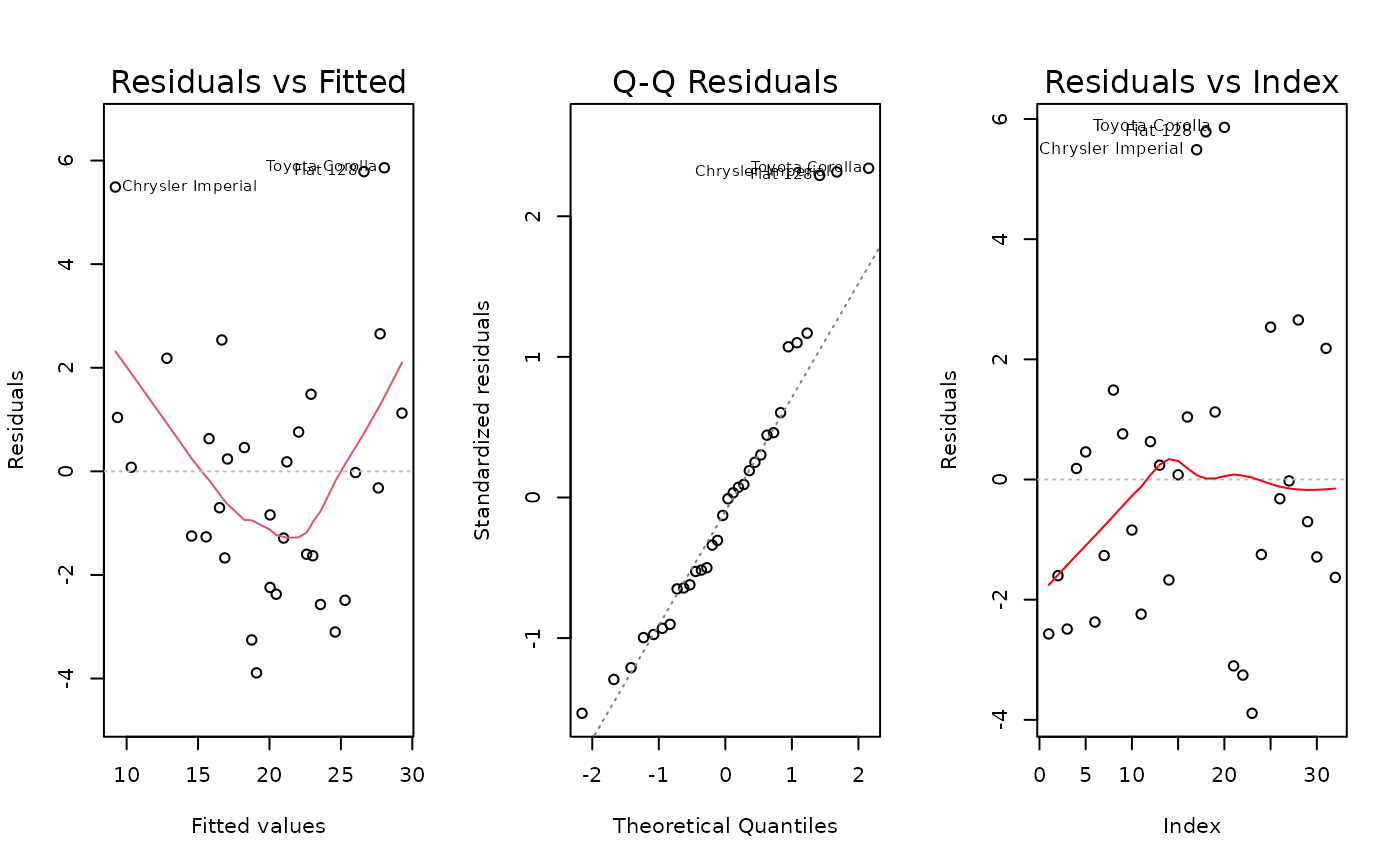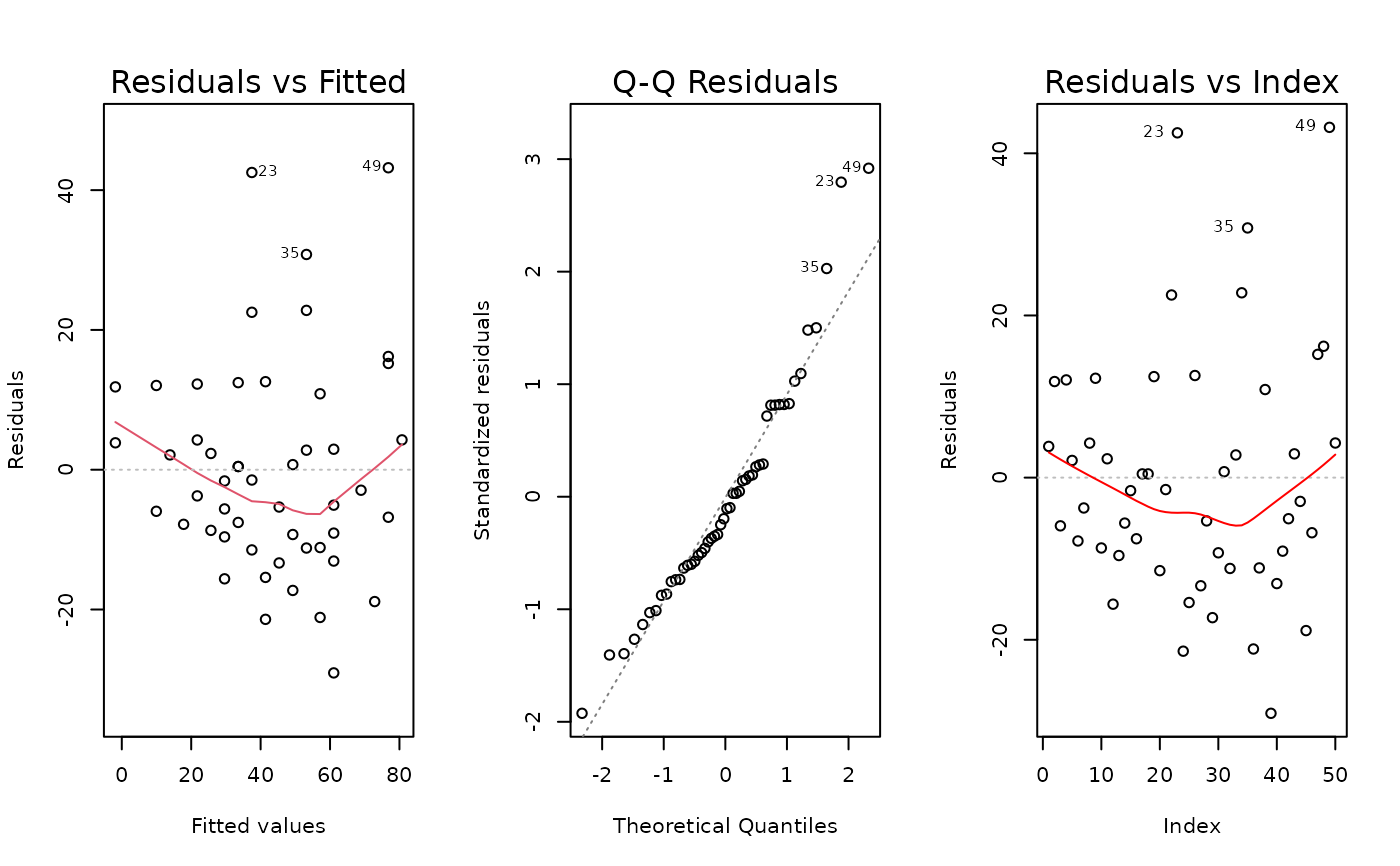
Generates a set of three diagnostic plots for a linear model object, side
by side: Residuals vs Fitted (checks linearity and constant variance),
Normal Q-Q (checks normality of residuals), and residuals in data order
(checks independence). Use it right after fitting a model to check the
regression assumptions in one call instead of building each plot yourself.
Graphical parameters (mfrow) are restored on exit.