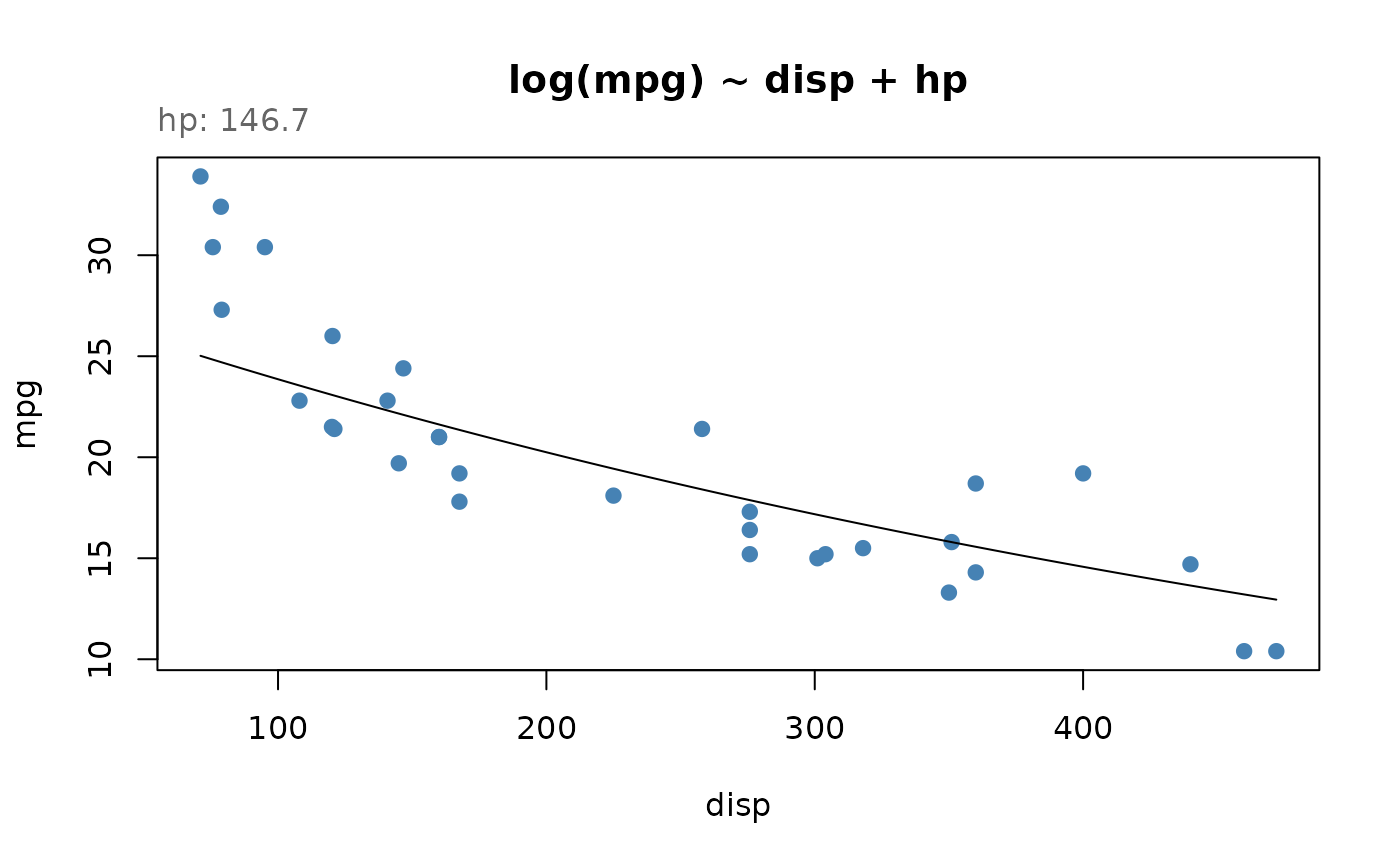
Take a linear model and display a 2D slice in base R. This function creates a new plot comparing the response y variable with one predictor x variable and displaying a linear model line with all other predictor variables held at constant values. For unspecified variables, the x_axis is assumed to be the first predictor in the model and all other variable are imputed (mean for numeric, first level for factors).
Usage
slice_2d(
  model,
  x_axis = NULL,
  n = 100,
  caption = TRUE,
  back_transform = TRUE,
  interval = "none",
  ...,
  xaxis = NULL
)
Arguments
- model
A linear model
- x_axis
A non-required specification of the x-axis variable; default is the first x var in the lm. May also be an expression of the model's predictors, such as
x_axis = "x * x_pos", in which case predictions are made at the model's own data points and placed at the expression's value.- n
Number of displayed points; default is 100
- caption
Boolean to include caption with values of predictor variables not shown in the chart, TRUE by default
- back_transform
How to map predictions onto the y-axis when the model's response is transformed. Default
TRUEauto-detects from the model formula;FALSEturns back-transformation off; a one-argument function (e.g.exp) or a name ("log","log10","log2","sqrt","exp","inverse") applies that transformation.- interval
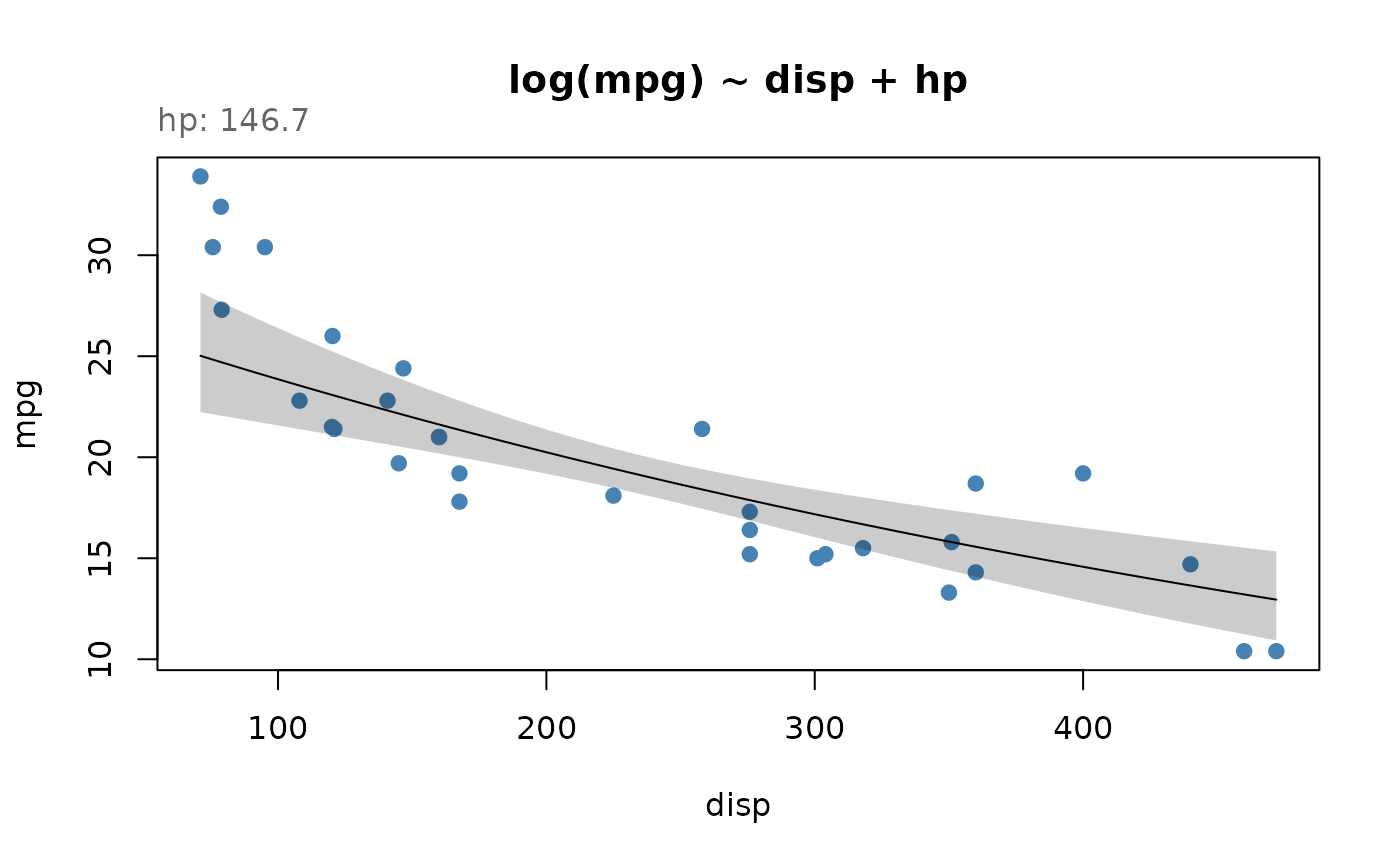
Draw a shaded band around the line:
"none"(default), or"confidence"/"prediction"for the correspondingpredict.lm()interval.- ...
Remaining vars (color, linetype, etc.)
- xaxis
Deprecated; use
x_axisinstead.
Examples
model <- lm(log(mpg) ~ disp + hp, data = mtcars)
slice_2d(model)
#> X-axis not specified - Used first x variable as x-axis
#> To specify, use 'x_axis = "var_name"' such as 'x_axis = "disp"'
#> Value for `hp` not specified - Used mean: 146.7
#> To specify, use 'var_name = value', such as 'hp = 146.7'
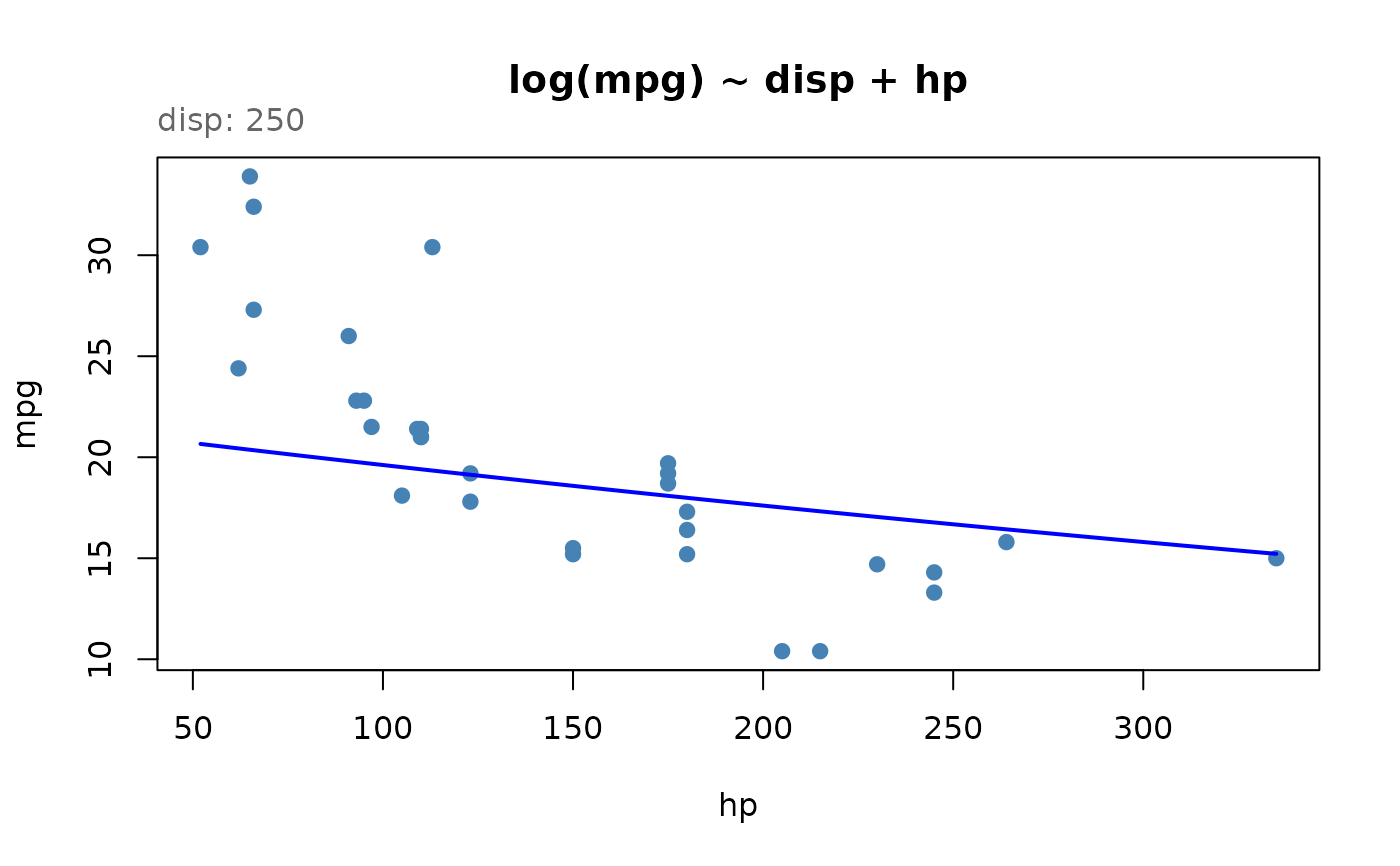
 # Choose the x-axis, hold disp at a value, and style the line
slice_2d(model, x_axis = "hp", disp = 250, n = 150, col = "blue", lwd = 2)
 # With a 95% confidence band around the line
slice_2d(model, interval = "confidence")
#> X-axis not specified - Used first x variable as x-axis
#> To specify, use 'x_axis = "var_name"' such as 'x_axis = "disp"'
#> Value for `hp` not specified - Used mean: 146.7
#> To specify, use 'var_name = value', such as 'hp = 146.7'